Financial Overview
Engineered for Profitability and Low Lender Risk
Clear projections, disciplined use of funds, and conservative assumptions.
Year 1 Income Statement (Summary)
Projections are built from fully costed menu items, realistic volume assumptions, and a conservative operating schedule. The focus is on maintaining strong cash flow, healthy margins, and ample coverage for debt service.
| Item | Amount (Year 1) | Notes |
|---|---|---|
| Total Revenue | $68,040 | Approx. 30 customers/day, 4–7 operating days/week over the year |
| Cost of Goods Sold | $21,774 | Food, beverages, and disposables (~32% of revenue, below industry norms) |
| Gross Profit | $46,266 | Gross margin of ~68% |
| Operating Expenses | $11,070 | Insurance, permits, fuel/propane, utilities, marketing, etc. |
| Debt Service (Loan Payments) | $4,872 | $20,000 @ 8% APR over 5 years (~$406/month) |
| Owner Draw (Planned & Flexible) | Up to $9,000 | Actual draws in early months expected to be lower to protect reserves |
| Projected Net Profit | $21,324 | ~31% net margin after all expenses, debt service, and planned draws |
In practice, the owners intend to delay or reduce draws during the first three months until the truck demonstrates stable cash flow. This provides additional protection for working capital and loan repayment.
$20,000 Capital Allocation
The $20,000 loan is the minimum viable capital required to purchase and convert the vehicle, outfit the kitchen, secure permits and insurance, and provide a buffer for loan payments and contingencies.
| Category | Amount | Description |
|---|---|---|
| Vehicle & Build-Out | $6,170 | Ambulance purchase, tax, registration, and basic construction/teardown materials |
| Kitchen Equipment | $7,014.50 | Refrigeration, prep table, panini presses, sinks, generator, water system, safety equipment |
| Permits, Licenses & Insurance | $1,500 | Municipal permits, health department permits, ServSafe certification, and initial insurance |
| Loan Payment Buffer (6 months) | $2,460 | Reserves to cover loan payments during build-out and early launch |
| Smallwares & Initial Inventory | $1,000 | Utensils, pans, containers, and first weeks of food and disposables |
| Contingency Reserve | $1,855.50 | Vehicle repairs, overruns, or unexpected build and opening costs |
| Total | $20,000 |
Budget & Layout Visualization
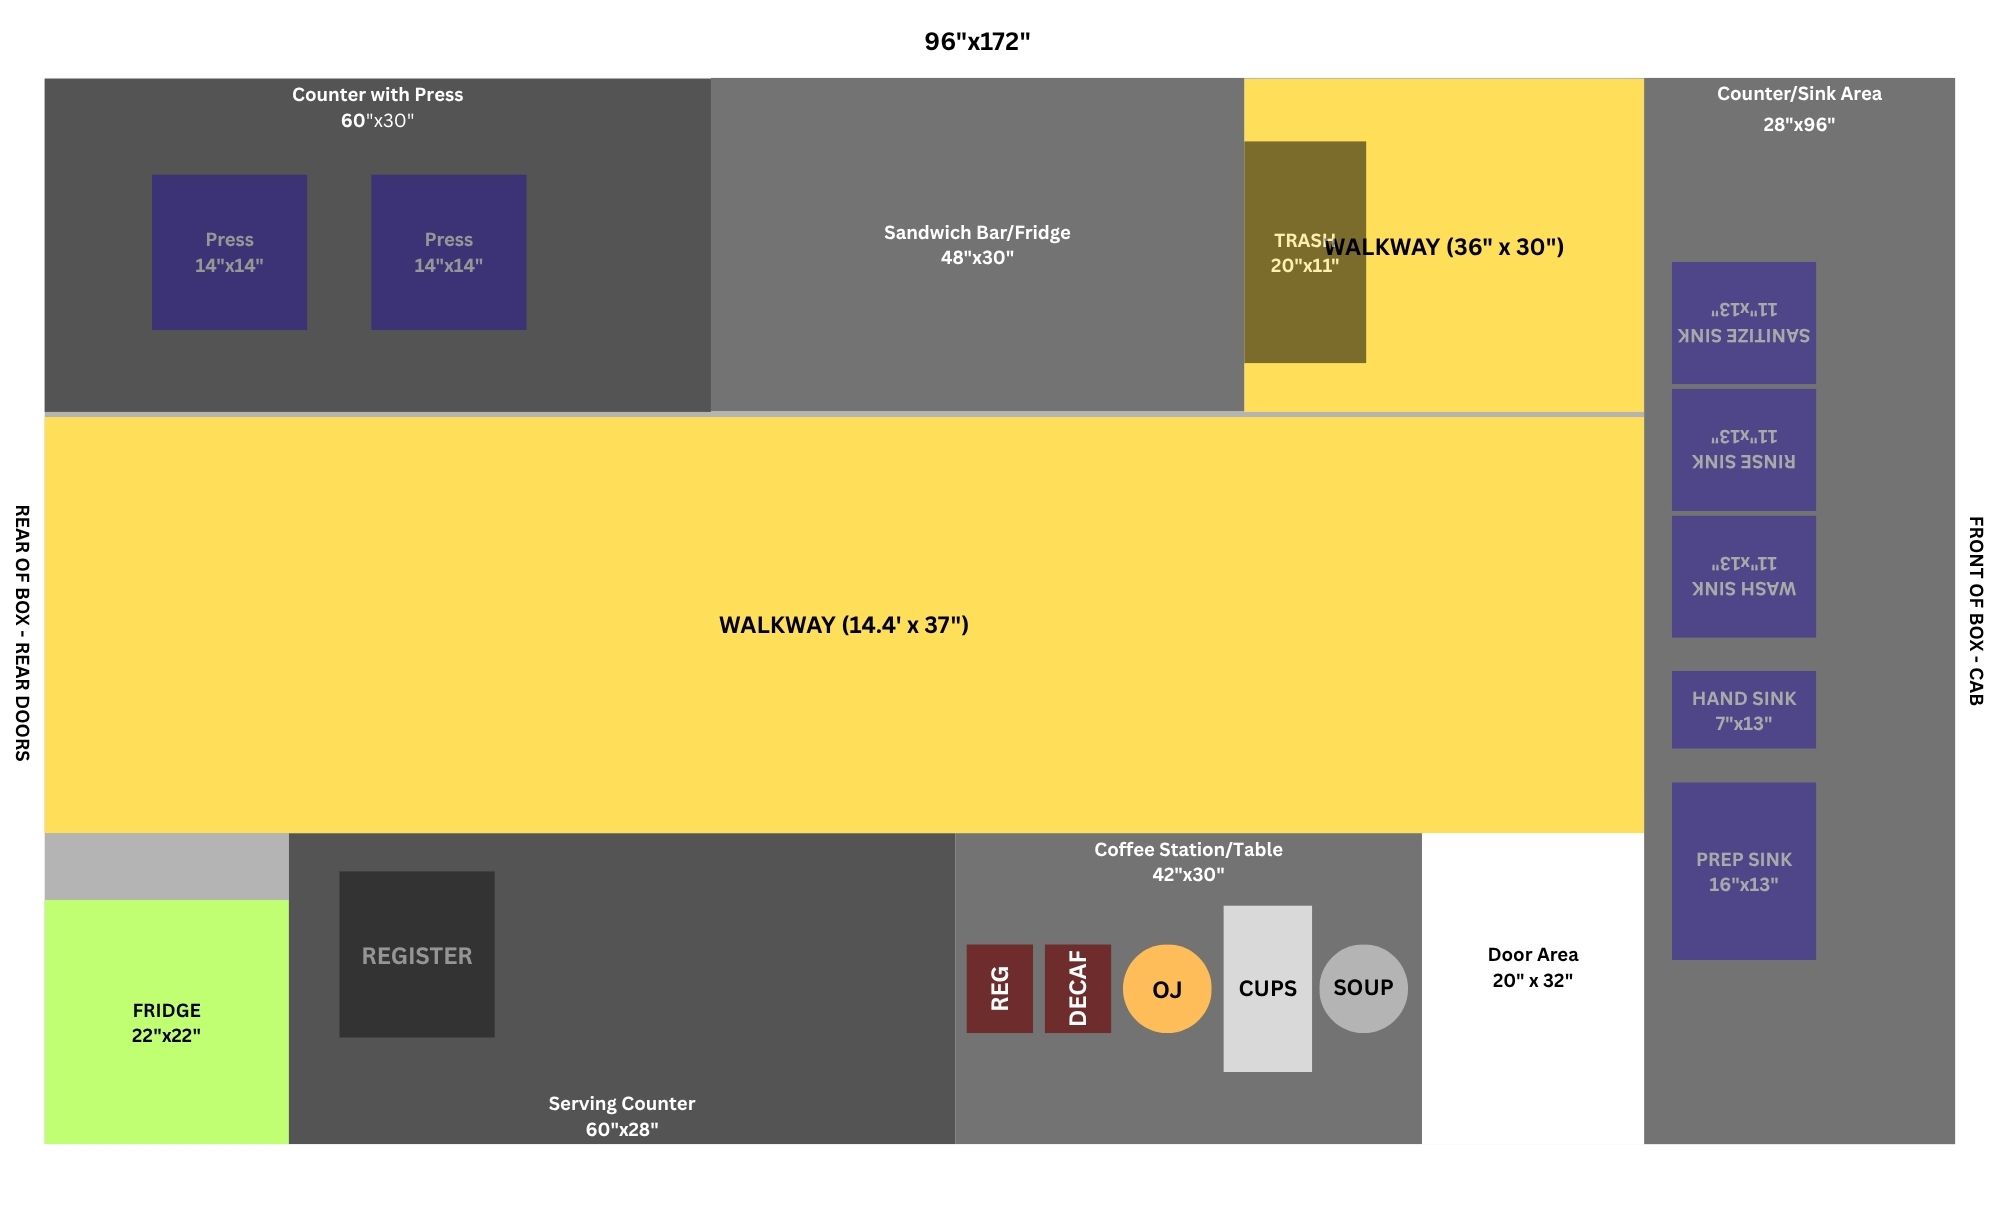
This budget is not just a spreadsheet; it is tied to two fully-costed, health-code-compliant physical layouts. This proves the project is viable whether we secure our ideal large-box truck or a more common small-box unit.
Ideal Layout (96"x172" Box)
This is our primary plan, built for the 48" NAFCOOL prep table listed in the budget. It offers a more spacious 14.4" walkway, optimizing workflow.
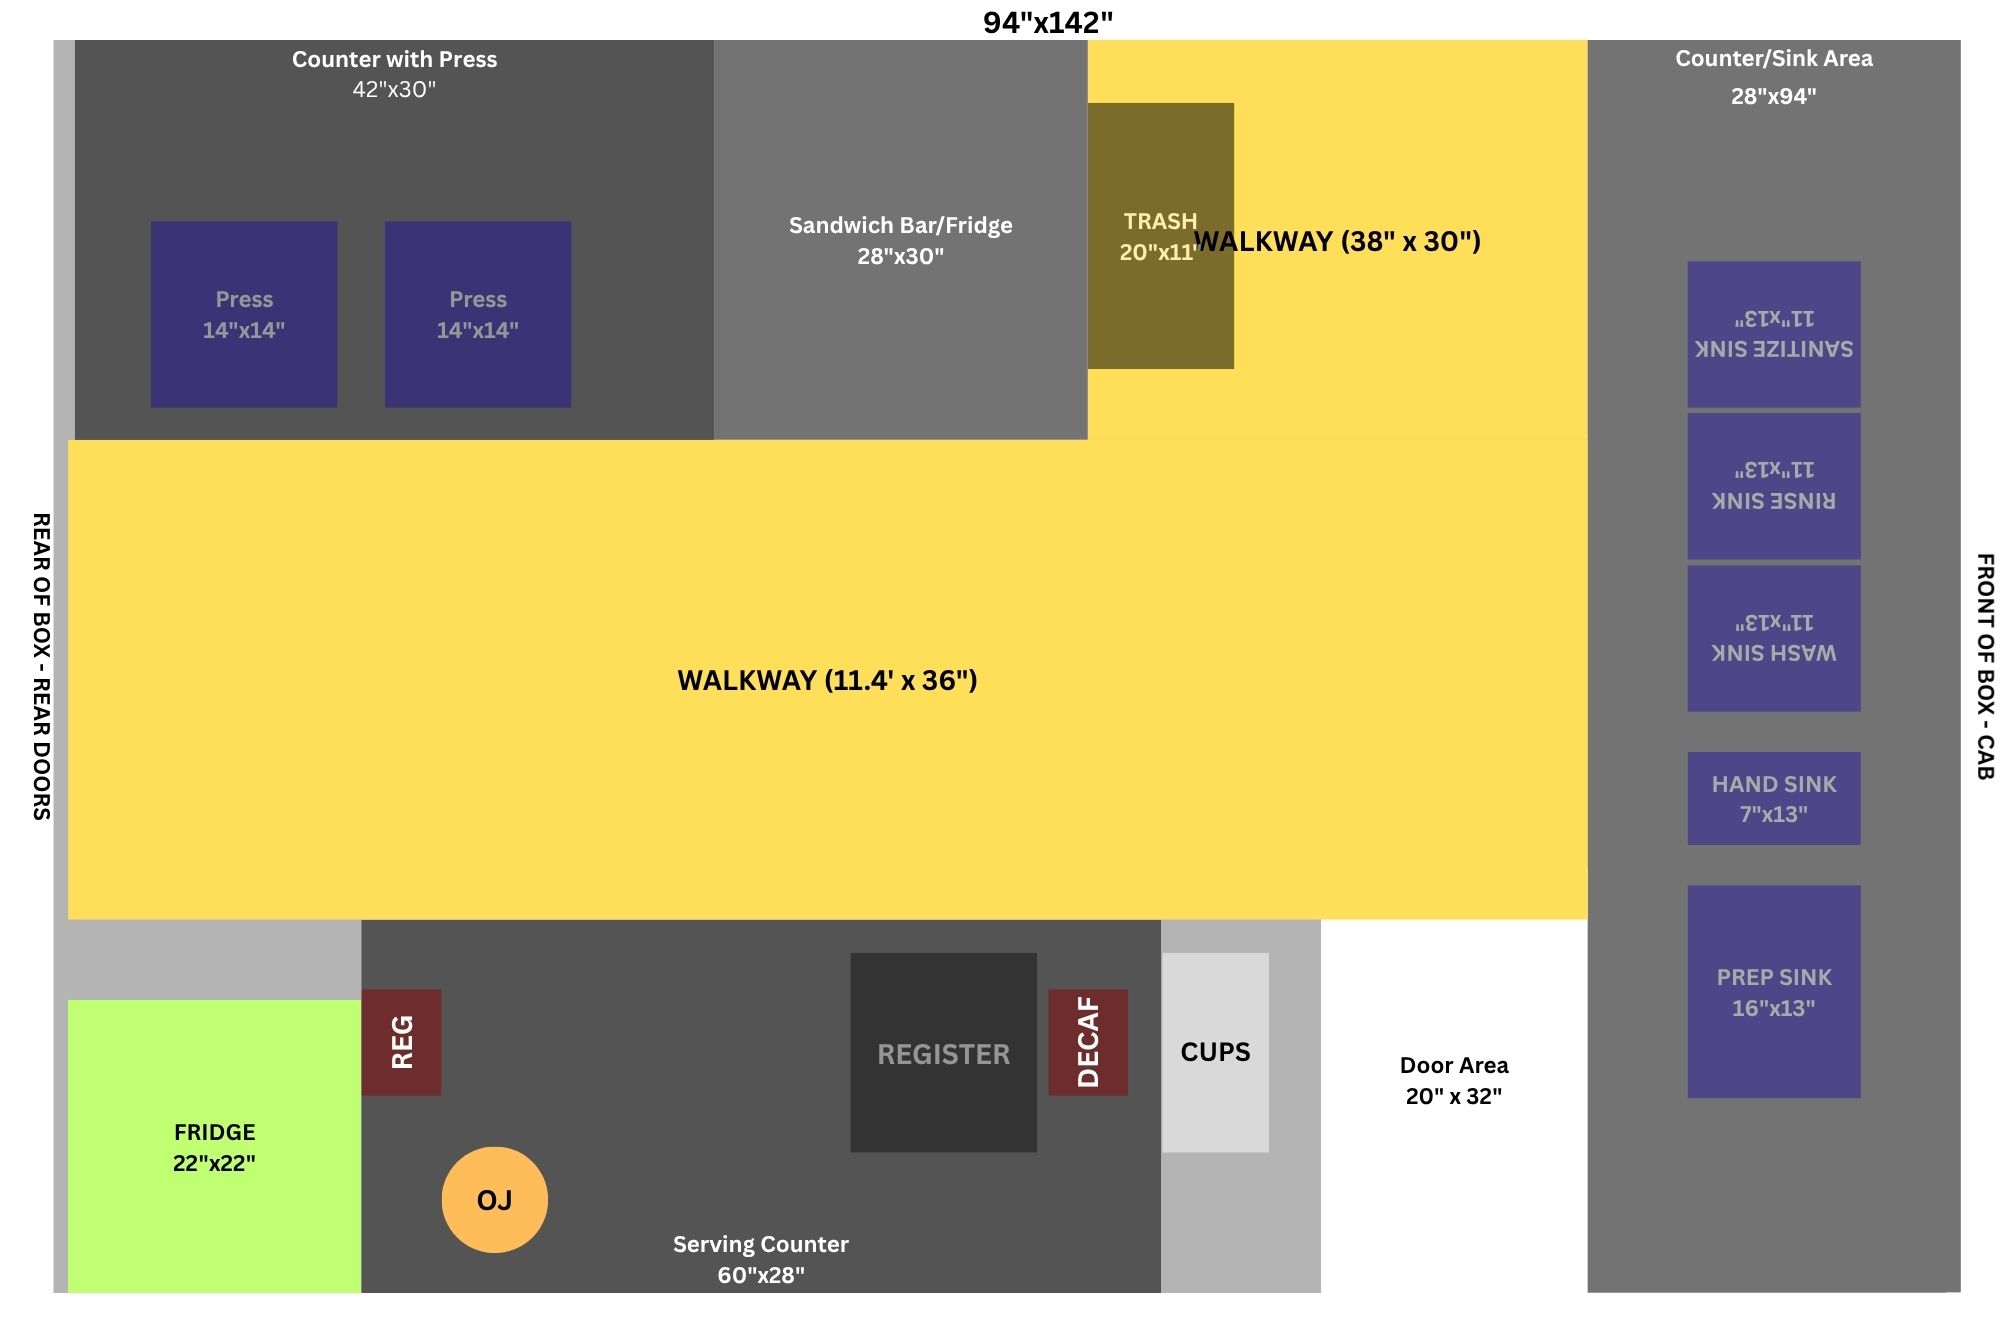
Contingency Layout (94"x142" Box)
This is our "worst-case-scenario" plan, proving we can launch in a smaller, more common ambulance. This layout swaps for a 28" prep table and is fully viable.
COGS & Menu-Level Economics
Each menu item has been costed line-by-line for ingredients, packaging, and beverages. The goal is maintaining COGS below typical industry ranges (35–40%) while keeping pricing fair for our market.
Breakfast bagel meals and core melts typically fall in the 21–32% COGS range (including chips and water), with an average around ~29% for meals. This provides a built-in buffer above our base food-cost target and helps protect margins if ingredient prices increase.